Key financial information
All amounts in € thousands, unless otherwise stated
Highlights 2014
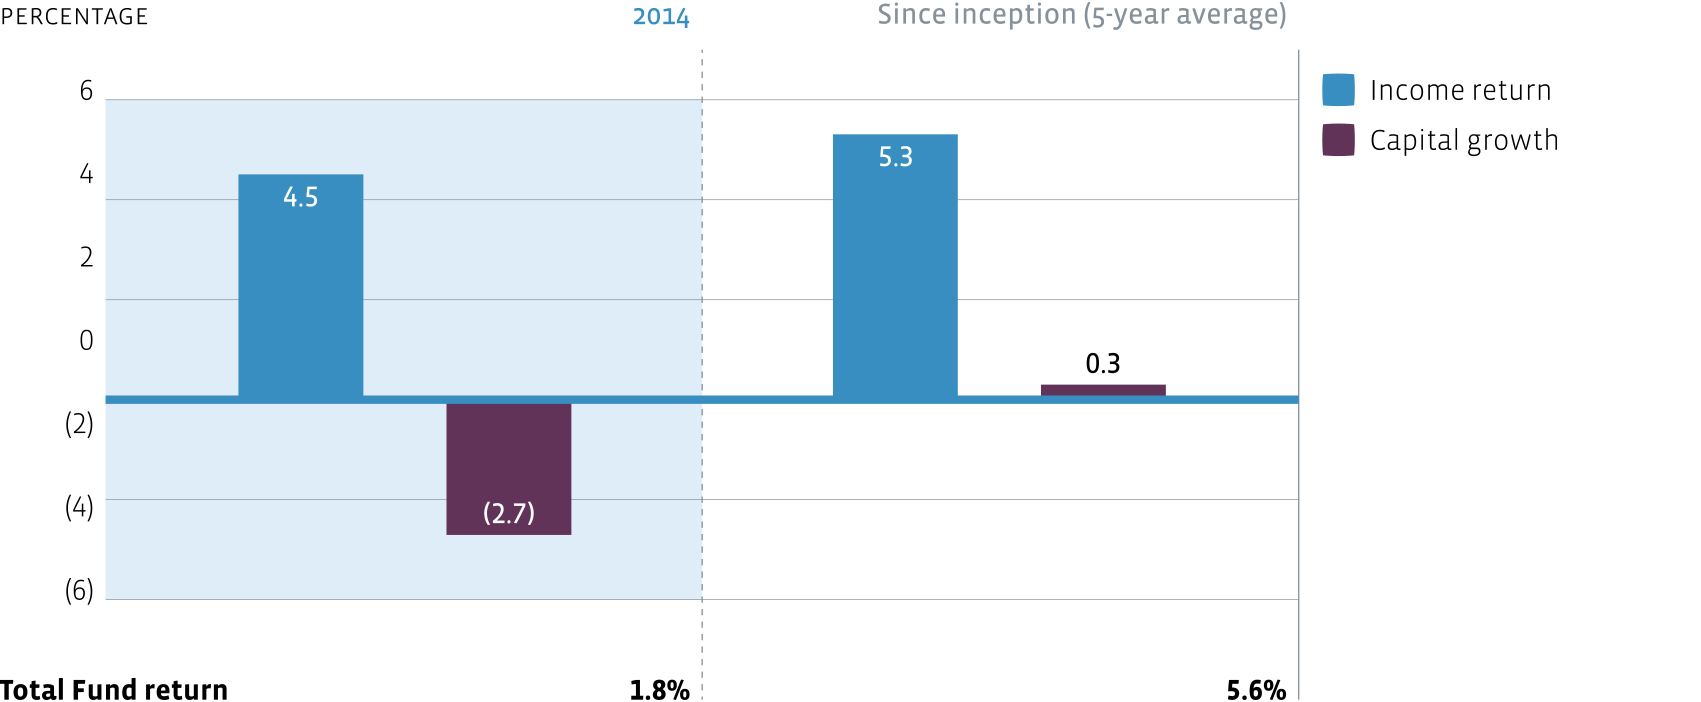
- Dividend return of 4.5%
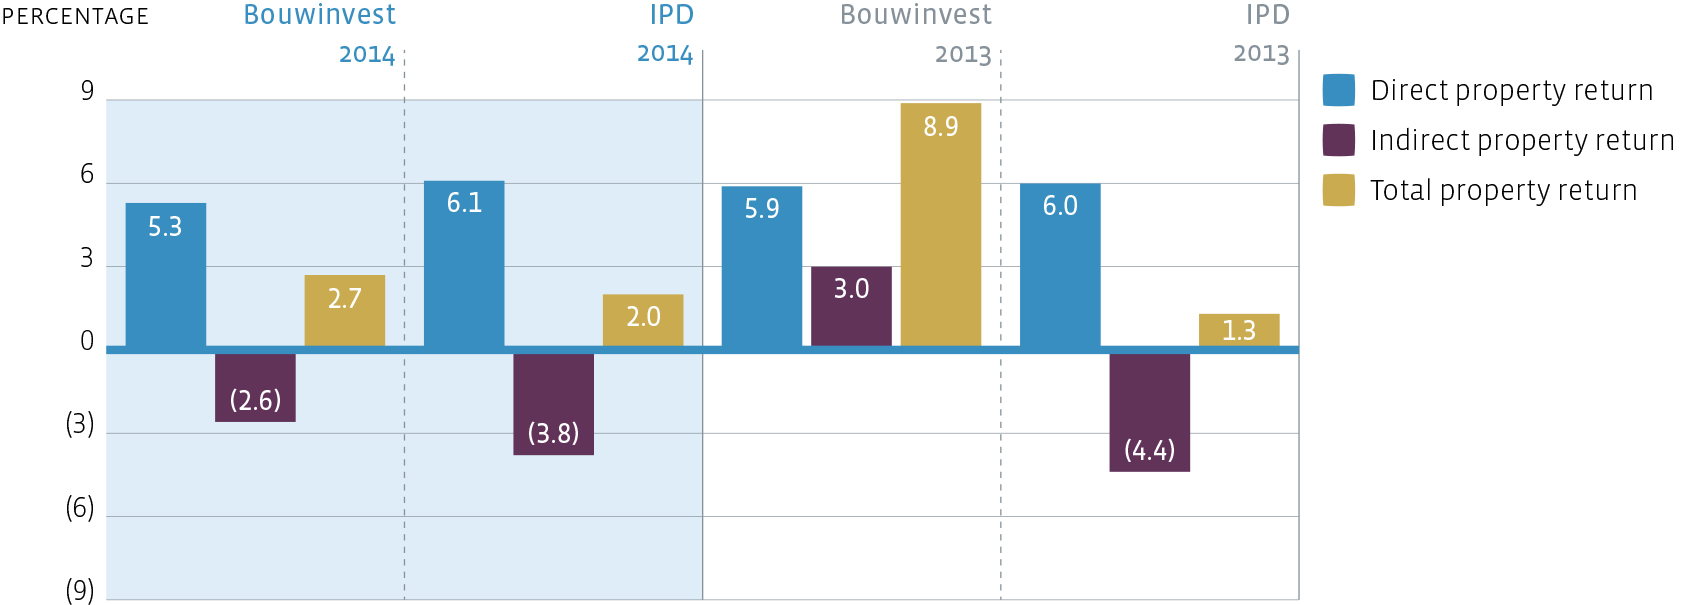
- Outperformance IPD Property Index (0.7%-point)
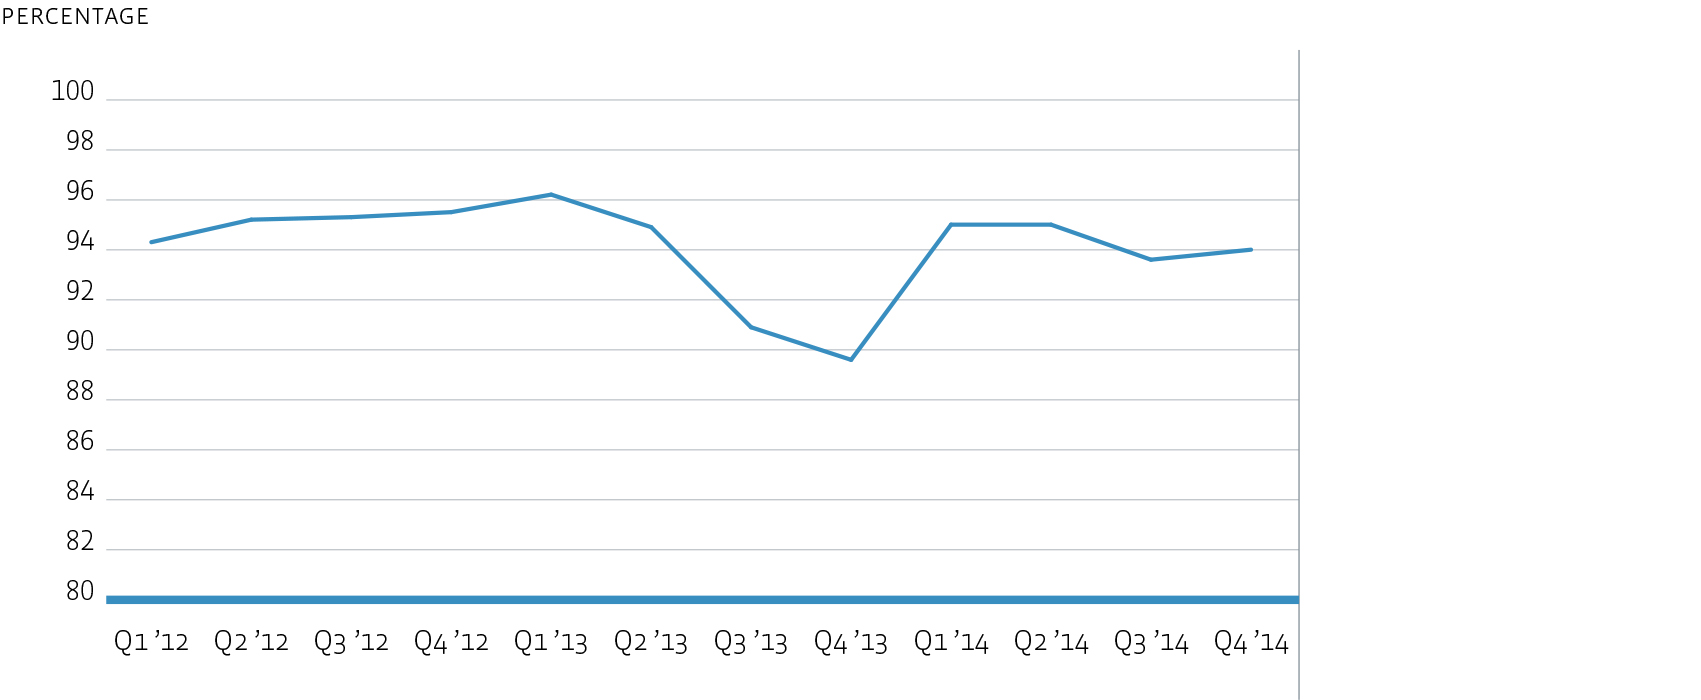
- Continued high average financial occupancy rate of 94.4%
- Acquisitions for a total of € 57.0 million
- Investments under construction of € 207.9 million
- New and extended lease contracts totalling 32,590 m2; rent value € 9.3 million
- New lease contracts redevelopments totalling 27,616 m2; rent value € 10.4 million
- Average remaining lease time of 6.8 years
- Divestment part of the assets in Ede € 13.0 million
- Like-for-like rent decrease of 2.5%
- Rent in arrears of 2.2%
- Secured pipeline of € 76.0 million
- 79.1% green energy label (A, B or C label)
- GRESB Green Star status two years ahead of schedule
| Performance per share | 2014 | 2013 |
| Dividends (in €) | 115.68 | 127.98 |
| Net earnings (in €) | 46.76 | 203.15 |
| Net asset value IFRS (in €, at year-end) | 2,527.09 | 2,594.04 |
| Net asset value INREV (in €, at year-end) | 2,544.13 | 2,608.41 |
Download XLS
| Statement of financial position | 2014 | 2013 |
| Total assets | 689,847 | 615,525 |
| Total shareholders’ equity | 670,322 | 605,784 |
| Total debt from credit institutions | - | - |
Download XLS
| Result | 2014 | 2013 |
| Net result | 11,185 | 47,149 |
| Total Expense Ratio (TER) | 0.57% | 0.57% |
| Real Estate Expense Ratio (REER) | 0.75% | 0.78% |
Download XLSFund return
Property performance (all properties)
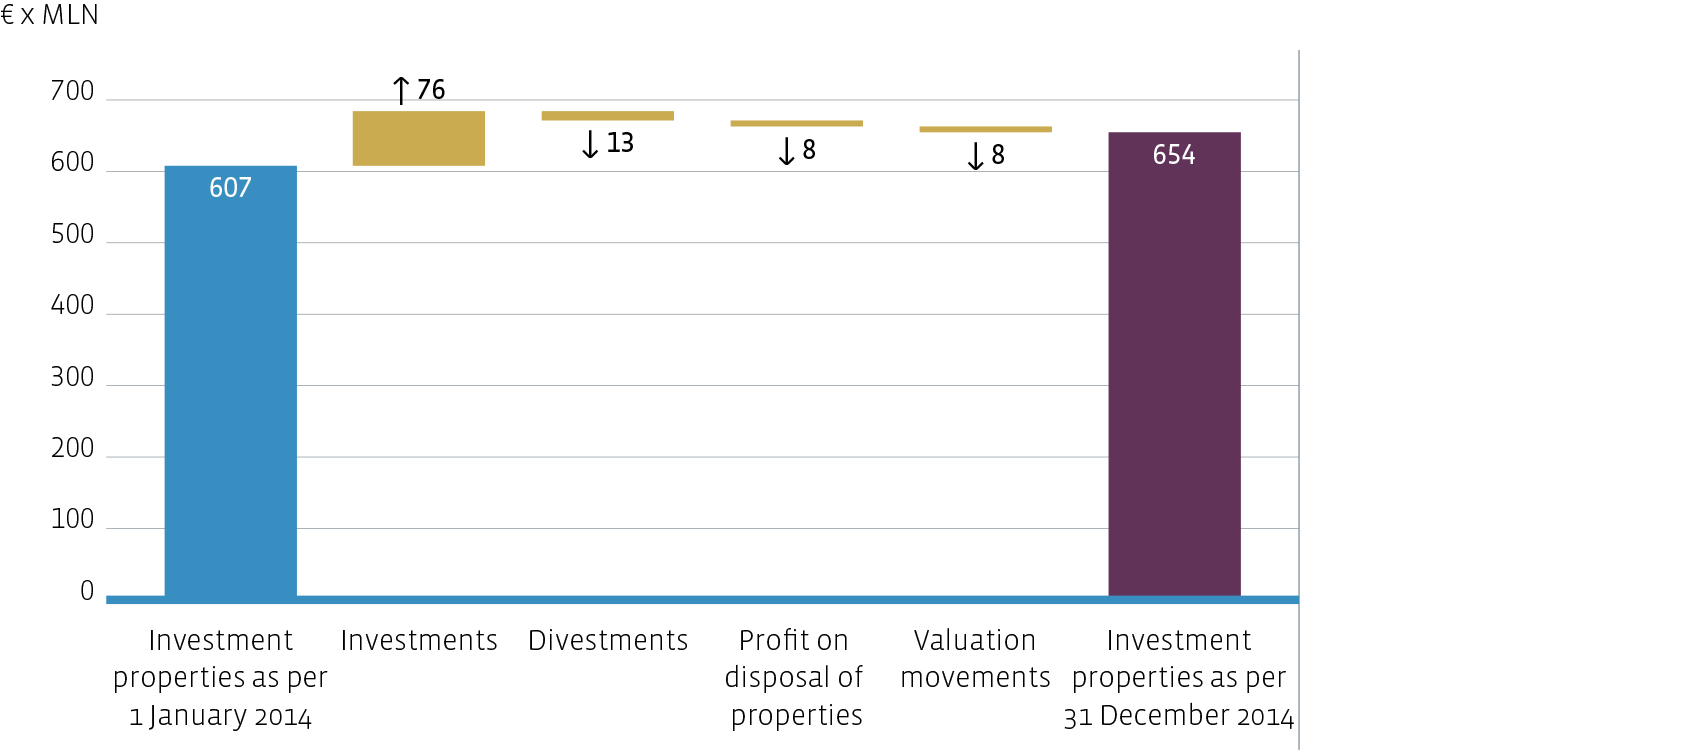
Portfolio movements
Financial occupancy rate
Portfolio figures
| | 2,014 | 2,013 |
| Investment property | 446,309 | 459,830 |
| Investment property under construction | 207,867 | 146,945 |
| Gross initial yield | 7.0% | 6.9% |
| Total number of properties | 41 | 39 |
| Average monthly rent per square metre (in €) | 190 | 210 |
| Financial occupancy rate (average) | 94.4% | 92.9% |
| Sustainability (A, B or C label) | 79.1% | 60.1% |
Download XLS